Welcome to Matrix Education
To ensure we are showing you the most relevant content, please select your location below.
Select a year to see courses
Select a year to see available courses
Worried about the scaling of marks and haven’t even considered the scale of maps and drawings? Well, we’re here to help. Standard 2 students need to know to scale drawings and maps. This topic has real-world applications in turning drafting drawings into life-sized products or interpreting maps.
A worksheet to test your knowledge. 
Free Y12 Maths Std2 Scale Drawings and Maps Download
Scale drawings typically refer to a representation of a real-world object, scaled down. A good example of a scale drawing is a map, 1 centimetre on a map may represent 10 kilometres in real life. From a scale drawing, estimations of area and volume may be acquired to provide insights such as the rainfall over the area in question.
NESA requires students to be proficient in the following outcomes:
To succeed in questions involving scale drawings and maps, it is essential to fully understand ratios. You should be able to confidently simplify a ratio into its simplest form, make a ratio between two quantities and to also divide a quantity into a given ratio.
Being able to read a map is an important part of day to day life. To understand the map better, the scale may have to be simplified. Simplifying a map scale is not too different to simplifying a normal ratio with the main difference being that you must now ensure both sides of the ratio are in the same units. After this, it should be the same simplification process as usual.
Example 1
A map has scale \(1 \ cm \ ∶ \ 10 \ km\), simplify this ratio.
Solution 1
\begin{align*}
1 \ cm \ &∶ \ 10 \ km\\
&= \ 1 cm \ ∶ \ 1 \ 000 \ 000 \ cm\\
&= \ 1 \ ∶ \ 1 \ 000 \ 000\\
\end{align*}
The Mathematics Standard 2 course requires you to be able to take measurements from a map despite not explicitly being given the scale. In these cases, it is essential to understand all the given information within the question and a sketch is strongly recommended.
Example 1
Determine the scale map of the 1cm×1cm grid below if the distance between \(A\) and \(B\) is \(10 \ km\).

Solution 2
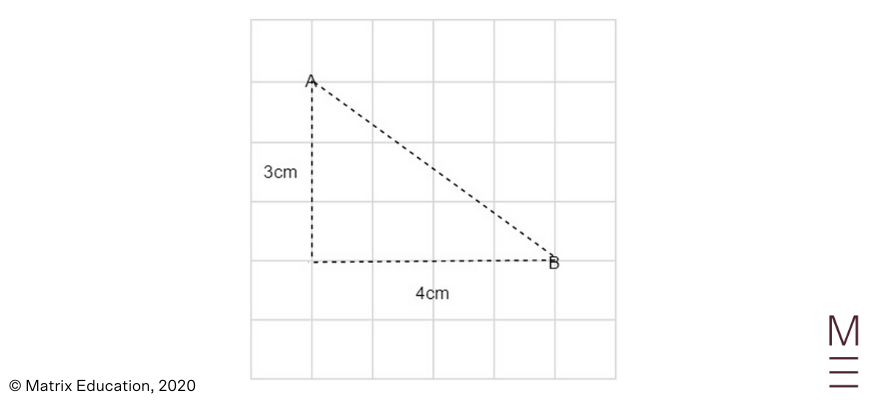
Distance \(AB = \sqrt{3^2+4^2}) \ = \ \sqrt{25} \ = \ 5 \ cm\) by Pythagoras theorem
Construct a ratio between the map and real measurements:
\begin{align*}
\text{map} \ &∶ \ \text{real}\\
5 \ cm \ &∶ \ 10 \ km\\
5 \ cm \ &∶ \ 1 \ 000 \ 000 \ cm\\
1 \ &: \ 200 \ 000\\
\end{align*}
The trapezoidal rule may be used to approximate the area of a section of land upon possibly being given a site plan, aerial photograph, radial survey or map. To use the trapezoidal rule, remember what you are essentially doing, that is, summing up a set number of trapeziums which roughly follow the shape of the area.
The area of a trapezium is \(A=\frac{a+b}{2} h\), where \(a\) and \(b\) are the \(2\) parallel sides and h is the height. Note that while performing the trapezoidal rule, the height normally refers to the horizontal width of each trapezium and this value is the same for all trapeziums.
Example 1
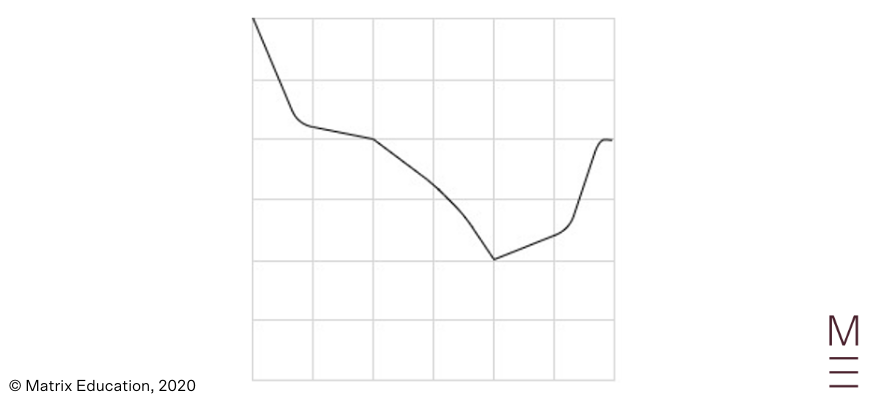
Use 3 applications of the trapezoidal rule to approximate the area under the curve.
Solution 1
3 applications of the trapezoidal rule means 3 trapeziums. The height of these trapeziums will thus be \(6\) boxes divided by \(3 = 2\) boxes. Now, mark in the \(a\)’s and \(b\)’s of each trapezium.
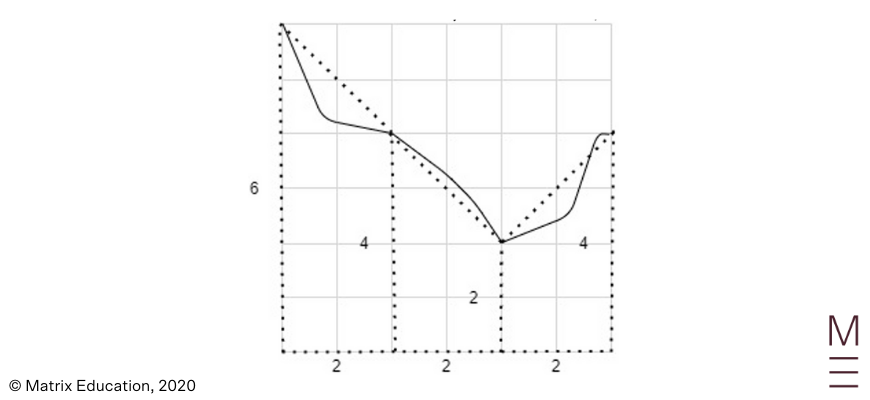
| \begin{align*} A &≈\left(\frac{6+4}{2}\right)2+\left(\frac{4+2}{2}\right)2+\left(\frac{2+4}{2}\right)2\\ &=22 boxes\\ \end{align*} |
Scale is \(1 \ \text{box} \ ∶ \ 10 \ 000 \ m^2\)
\begin{align*}
∴A&≈22×10 \ 000 \ m^2\\
&≈220 \ 000 \ m^2\\
\end{align*}
The area bounded by the dotted lines is what was calculated and compared to the true area, the area bounded by the solid black line, we can see that the first and third trapeziums overestimate the real area while the second trapezium underestimates it.
Rainfall over an area can be calculated from the formula,
\(V=Ah\)
Where \(V\) is the volume of rain, h is the height or depth of the rain and \(A\) is the area over which it falls.
Example 1
Calculate the total volume of rain which fell over a \(100 \ m \times 200 \ m\) farm, if \(20 \ mm\) of rain fell over the farm.
Solution 1
\begin{align*}
A &= 100 \ m \times 200 \ m =20 000 \ m^2\\
h&=20mm =0.02 \ m\\
V&=20 000 \ m^2 \times 0.02 \ m=400 \ m^3
\end{align*}
Therefore, there was \(400\) cubic metres of rainfall over the farm.
1. Simplify the map scale \(1 \ mm \ ∶ \ 5km\)
2. By using 1 application of the trapezoidal rule, estimate the area of the garden bed below.
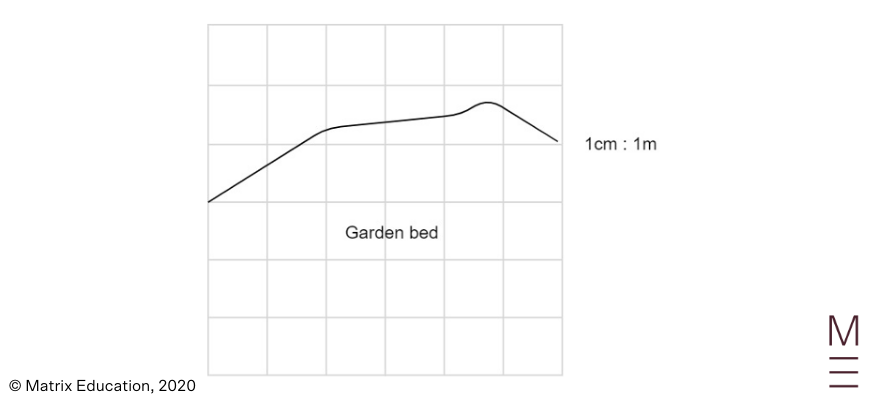
3. If 10mm of rain falls over the garden bed, estimate the volume of rainfall over the garden bed in cubic metres.
1. \(1:5 \ 000 \ 000\)
2. \(21 \ m^2\)
3. \(0.21 \ m^3\)
© Matrix Education and www.matrix.edu.au, 2023. Unauthorised use and/or duplication of this material without express and written permission from this site’s author and/or owner is strictly prohibited. Excerpts and links may be used, provided that full and clear credit is given to Matrix Education and www.matrix.edu.au with appropriate and specific direction to the original content.